 |
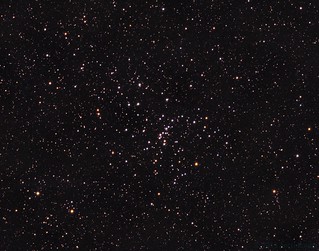
| LRGB image of Messier 48 taken in April 2013 |
The process itself is quite straight forward as described. Once images are calibrated, registered and stacked, you simply generate CSV files from V and B channels (green is close to photometric V) using the FWHMEccentricity script in PI. From my image it found 1266 stars for G and 836 for B.
For reference data on actual magnitude you then solve the image and use AnnotateImage to generate a file containing Tycho catalog data on found stars (found 241).
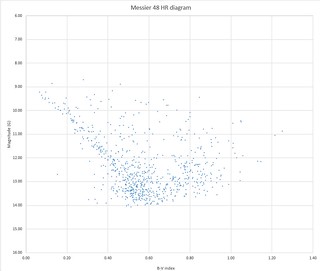 |
| Hertzsprung-Russell diagram of Messier 48 with 809 stars |
Flux=(A*SizeX*SizeY*Pi/3)and all stars on all files get a positional index
Index= int(X)+int(Y)*ImageWidththat is later used to correlate individual stars. If you use Excel, put Index into column A. The flux is converted to magnitude scale with
mag=-2.5 * Log10(flux)
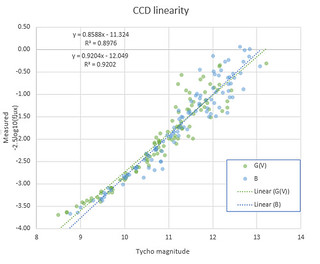 |
| SXVR-H18 CCD linear fit shows anti-bloom gate effect on the brighter stars bottom-left |
Once you have your calibrated magnitudes from your image data, you can create the final column, "B-V" and use it with V (or G) to create a scatter plot. Put V as the vertical axis and reverse the axis to increase downwards. Clamp the ranges, adjust styles and enjoy your newly generated (pseudo)science. If all goes well, you should be able to see a plot that matches some region of the real star sequence plots. My M48 seems to be a pretty good match on main sequence and sub-giant stars.